Top Indicators Every Stock Trader Should Know

The stock price is rising. Should you make a purchase now or will the rally reverse soon? Making such decisions for traders might prove to be tough if they rely only on price actions. Technical indicators may come in handy here, as they won’t tell the future of the market, but they could help traders understand what trends, momentum and volatility are, as well as potential entries/exit points. It’s essential to know what an indicator says and not to use all of them from the list offered by a trading platform.
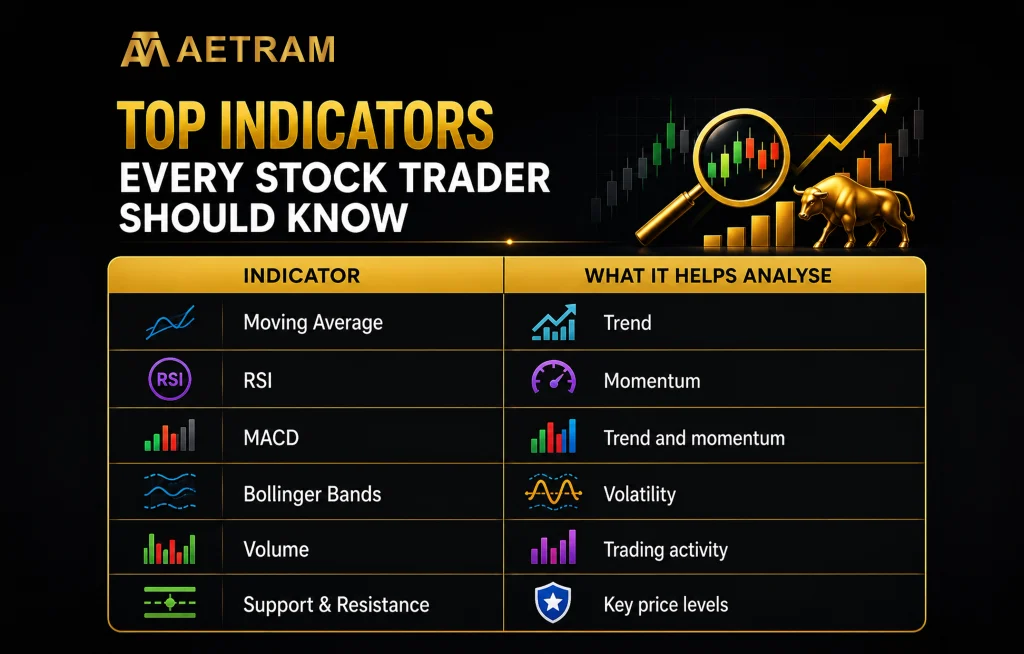
Moving averages
Moving averages belong to one of the simplest groups of technical indicators. They smoothen price actions and let traders analyze trends. In other words, moving averages could be used to trace both the trend as a whole and the recent price action. But traders need to compare various moving averages to detect possible changes in momentum. However, moving averages are based on historical price data, which is important to keep in mind.
Relative Strength Index (RSI)
Relative Strength Index (RSI) is a momentum indicator which gauges the velocity and magnitude of price movements. This indicator is normally used to determine if a stock has been showing strength or weakness. Normally, RSI is computed between 0 and 100. Readings above 70 are normally seen as overbought levels and readings below 30 are seen as oversold levels. But a stock may stay overbought or oversold for quite some time. Hence, RSI needs to be looked at in conjunction with other indicators.
Moving Average Convergence Divergence (MACD)
MACD is an oscillator type momentum indicator which can be used by traders to identify changes in the momentum of a trend. Traders normally use the convergence of MACD line and signal line to predict changes in the momentum. MACD is very helpful when used in conjunction with price action and other indicators.
Bollinger Bands
The Bollinger Bands are used to analyze price volatility. The Bollinger Bands indicator comprises a moving average line as well as upper and lower bands that move depending on the level of volatility. As the bands move further apart, it means that volatility is high. On the other hand, narrowing of the bands may imply relatively low volatility. The trader may utilize the Bollinger Bands in order to gauge how volatile the prices are, but he or she should not interpret a touch of the band to mean that a reversal will take place.
Volume
Whereas the price gives you an idea of where the stock is trading, the volume provides a clue about how active the stock is. For instance, a price action coupled with high volume suggests that the market participants are actively engaged. On the other hand, a price movement with relatively low volume calls for more caution.
Support and Resistance Levels
Even though not an indicator, support and resistance are essential concepts for traders. While support refers to the price level at which buying pressure could appear, resistance is the price level at which selling pressure might be expected.
What Technical Indicators Can and Cannot Tell You
| Indicator | Can Help You Understand | Cannot Guarantee |
| Moving Average | Trend direction | That the trend will continue |
| RSI | Momentum and potential overbought/oversold conditions | That a reversal will happen |
| MACD | Momentum and potential trend changes | The exact future price |
| Bollinger Bands | Volatility and price range | That touching a band means reversal |
| Volume | Strength of market participation | Whether price will definitely rise or fall |
| Support/Resistance | Important price levels | That a level will definitely hold |
Do Not Rely on Only One Indicator
There is no indicator that would accurately predict the price behavior of the stock. All indicators provide a certain view of the market. Utilizing several indicators will allow you to gain a bigger picture, although using too many can result in contradictory information.
Utilizing Indicators Together
Now consider Amir who is trying to buy a share that has just risen from ₹450 to ₹500. Instead of purchasing it just on the basis of increasing prices, he evaluates a few indicators:
- The stock is above its moving average implying that there is an upward trend in the market.
- The RSI is 58 which implies that the price action is having momentum, but not oversold.
- The MACD is showing positive momentum.
- There is more trading volume than normal.
- Resistance can be seen at ₹520.
Without depending on a single indicator for a buy decision, he takes all these things into account along with his trading strategy and risk management approach. This scenario illustrates an important point that technical indicators perform best when they act as support tools instead of decision-making tools by themselves.
Technical Analysis Checklist
When initiating a position, keep in mind:
- What is the general direction of the price?
- What is the momentum telling us?
- Is the trading volume confirming the price action?
- Are there any support or resistance levels close by?
- Is the stock unusually volatile?
- Where do I plan on buying?
- Where will my stop be if the trade goes south?
This will help you to analyze a trade through a more systematic approach instead of focusing on one indicator only or basing your decisions on emotions.
Indicators Should Be Used to Guide Your Trading
Indicators will not give you any accurate predictions. There are a lot of different factors which may affect the market movement: news about a company, economical situation, global events and so forth. The best way to use technical indicators is to understand what they measure, incorporate price and volume into your analysis and trade based on the whole picture and risk management. Do not buy only because an indicator suggests that you do. Buy when the whole scenario suits your trading plan.
For more practical insights on stock trading, investing and financial markets, explore Aetram.
Frequently Asked Questions
- What is a technical indicator in stock trading?
A technical indicator is a mathematical tool that uses price, volume or other market data to help traders analyse trends, momentum and volatility. - Which indicator is best for beginners?
Moving averages and RSI are relatively easy to understand, making them useful starting points for beginners. However, no single indicator works best in every market situation. - Can technical indicators predict stock prices?
No. Indicators can help identify patterns and potential signals, but they cannot guarantee future price movements. - Should traders use multiple indicators?
Using a few complementary indicators can provide better context. However, using too many can create conflicting signals and make decision-making more complicated. - Is volume important when using technical indicators?
Yes. Volume can help traders assess the strength of a price movement and provide additional context when evaluating breakouts or trend changes.