Different types of profitability ratios and how to use them

Businesses all over the world try to increase sales and subsequently net profits. But there are many companies in the world that post record sales and still report low or negative returns. Investing in these companies may even be a poor investment decision.
Rising revenue may indicate that the company is growing and expanding its market share. But it tells very little about how the business is converting that revenue into real profits for its owners.
To measure that gap, we have profitability ratios and every investor, whether beginner or experienced, must know these ratios to analyze the company properly and make an informed decision. These ratios are useful to study any kind of companies, be it large-cap, mid-cap or small-cap.
In this blog, we will discuss the main types of profitability ratios, and understand the practical ways to use them before you start investing.
Meaning of profitability ratios
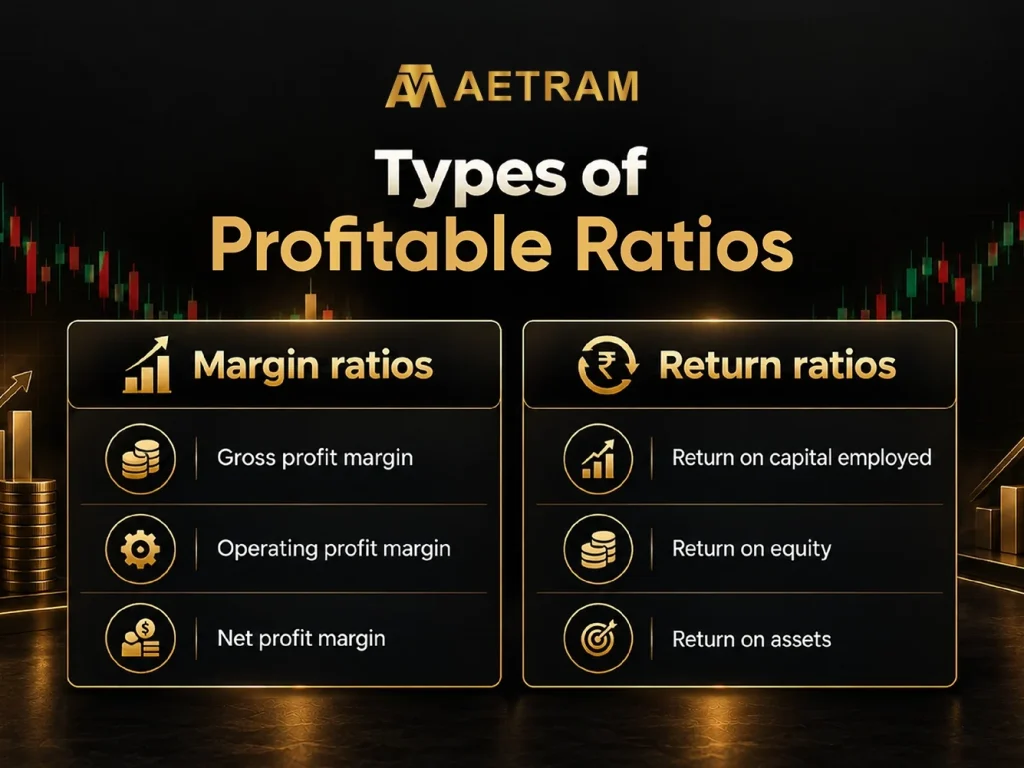
Profitability ratios show how effectively a company earns profit from its sales, assets and shareholder money. They fall into two broad categories:
Margin ratios measure different types of profits as a percentage of sales during that particular period. There are different types of profits like operating profit, net profit and gross profit. Different margin ratios are calculated on these different kinds of profits as against the revenue. It tells us how much the company is able to save or keep it to itself from each rupee of sales after deductions like expense, interest, etc.
Return ratios measure how efficiently the company is operating as against the money/capital invested in the company. In other words, it tells us how effectively a company uses its resources like assets, equity or total capital to generate profits. Some of the return ratios we will be discussing here are return on capital employed, return on equity and return on assets.
You need both, because a business can have fat margins and still earn poor returns if the capital is underutilized or sits idle.
To calculate these ratios, you will need two financial statements called the balance sheet and profit & loss statement. These two financial statements are published every quarter and at the end of the financial year by every listed company in India, according to SEBI’s disclosure rules. You can find them on NSE and BSE websites by searching for the company name.
Importance of profitability ratios
Profitability ratios are important for people who are analyzing a company’s performance and they serve multiple purposes for Indian businesses and investors.
Investors use them to identify quality companies having sustainable competitive advantages or economic moats. These ratios are also used to compare with peers from the same sector or industry or against the overall industry average.
Promoters of companies and business owners use them to determine cost inefficiencies, set pricing strategies, make arrangements for bank loans or investor pitches. Lenders and PE funds routinely examine net margin trends and ROE. Managers use them for internal benchmarking, performance evaluation as well as budgeting purposes.
Though higher ratios are generally expected and they signal stronger company fundamentals, context is everything. A net profit margin of 5% may be excellent for a high-volume retailer but weak for a software services firm.
In an environment of fluctuating commodity prices, GST impacts, and interest rate cycles, consistent or improving profitability ratios signal operational resilience.
Types of profitability ratios
1. Margin ratios
1.1 Gross profit margin
The formula for gross profit margin is (Gross profit/Revenue) x 100.
Formula for calculating Gross profit is: Revenue – Cost of Goods Sold.
A company having a strong gross margin consistently usually points to a strong cost advantage. In India, software and pharma companies often report healthy gross margins. Meanwhile commodity-linked businesses such as metals and sugar see their gross margin being thin or volatile due to fluctuating input prices.
If the gross margin starts to decline for a few quarters, it means the company is losing pricing power or absorbing cost inflation it cannot pass on to the customers. It may also indicate increasing competition in that industry, poor procurement and the inability to increase selling prices compared to rising cost.
1.2 Operating profit margin
The formula is (Operating Profit / Revenue) × 100. Operating profit is also called earnings before interest and taxes (EBIT).
Operating Profit (EBIT) = Gross Profit – Operating Expenses (including depreciation and amortisation). While calculating operating profit, it does not take into account the interest and expenses.
The operating profit margin tells us about the efficiency of day-to-day business operations. IT companies, SaaS companies, any business with an asset light model is likely to have a higher operating profit margin. But companies which have high capital expenditure (capex) like manufacturing firms or infrastructure companies will have lower operating profit margin.
If a company is able to have a high operating profit margin, then the company would be in a better position to absorb interest costs even when the cost increases. The company will have operating leverage when the margin is high.
1.3 Net profit margin
The formula for net profit margin is (Net Profit/revenue) x 100. Net profit is also known as the bottomline or net income or profit after tax (PAT). While calculating net profit, the interest and the taxes are factored in. so net profit or net income is the final money left for shareholders after deducting all expenses, interest, depreciation, amortization and taxes.
This ratio is used for determining the overall efficiency of the company and the impact of the company’s capital structure. This is also useful for planning taxes. Indian companies in the IT or pharma sectors, for example, post strong net margins. These kinds of companies generate robust free cash flows. It helps MSMEs seeking bank credit.
Having said that, if a company has high gross margin but reports low net margin, then it indicates that the company is having high operating expenses or raising capital at high interest rates or due to tax inefficiencies.
2. Return ratios
2.1 Return on capital employed
The formula for ROCE is (EBIT/Capital Employed) x 100.
Capital Employed calculation: Total Assets – Current Liabilities
ROCE metric is used to measure the return on all long-term capital, both equity and debt. That makes it a fairer metric than ROE for companies with significant borrowing. A good rule of thumb is that ROCE should be higher than the company’s cost of borrowing. If a firm borrows at 10% and has a ROCE of 19%, every rupee of debt is creating value. If ROCE is below the interest rate, then the growth is funded by debt and it is destroying the company’s value. It also indicates the company management’s ability to deploy capital productively.
2.2 Return on equity
The formula for return on equity (ROE) is (Net Profit / Average Shareholders’ Equity) × 100
It is one of the closely watched ratios by equity investors because the formula measures the return generated on shareholders’ funds. To put it in simple terms, the ratio tells us how much profit a company makes for every Rs 100 of shareholder money. If the ROE is high, say 15% or more, it is considered the company is putting shareholders’ money to efficient use.
As an investor, it is better to consider companies with high ROE and less debt. Because high debt can weigh on the company and subsequently on the shareholders. If a company shrinks its equity base through heavy borrowing or buybacks, ROE can rise but there would not be any meaningful improvement in the company’s performance. Always check for both ROE and debt-to-equity ratio. This matters especially for banks and NBFCs, which run on leverage by design.
2.3 Return on assets
Return on assets is calculated by the formula: (Net profit/Average total assets) x 100
This ratio is used to gauge how well the company uses its assets like inventory, machinery, raw materials, receivables, etc. to make profit. Asset-light businesses like software or consulting, etc. report higher ROA than asset-heavy businesses which are in the sectors like steel, power, infrastructure, automobiles, etc.
If ROA of a company is increasing, it means the company is improving its asset utilisation and better capacity utilization. In contrast, if ROA is falling, then it may be due to underutilized capacity, rising unsold inventories, poor working capital management, operational inefficiencies, etc.
Using profitability ratios
Use these ratios to look for a trend or pattern with respect to a company’s operational efficiency and the kind of returns it gives. A company which is able to post steady returns and higher margins during various business cycles is a strong company.
These ratios can be used to analyse a company’s operations with other companies from the same industry or sector. However, it should be used to compare companies from different sectors because the result would be distorted and it would not give the right comparison.
You should not use these ratios separately but you should pair it with other ratios like debt-to-equity and interest coverage ratios. This is to make sure profits are not being made through a lot of borrowed money. You must also look at P/E and P/B ratios (valuation metrics) because you should not end up over paying for a good business as it could become a poor investment.
Where these ratios fall short
Financial ratios like the ones we discussed above are useful for evaluating companies but the use of ratios as analytical tools has its limitations.
Ratios are calculated on historical numbers based on accrual accounting. So if we are using it as an indicator for evaluation, it would be a lagging indicator. It would also be misleading if we are taking into account some non-cash items or some one-offs financial items or aggressive accounting is used.
These ratios ignore qualitative issues such as corporate governance, management quality, brand image, regulatory problems, intensity of competition, etc. The relevance of these ratios also vary across various industries and therefore comparisons should only be made within industries.
Whenever you are doing quantitative analysis, you must also do qualitative analysis. The analysis of cash flow statements, company’s governance quality, overall economic environment, sectoral performance, etc. should not be ignored.
Final thought
Profitability ratios provide a clear window into a company’s financial health and efficiency. From an Indian perspective, they help investors to identify quality compounders, owners of businesses to improve efficiency. It is also used to make data-driven decisions with respect to cost, pricing, inflation, competition, etc.
Understanding these ratios and apply them with proper context will help you make better investment decisions. Whether you are evaluating your own P&L or screening stocks, start with the fundamentals of profitability, because sustainable profits only lead to growth and it remains as the foundation of long-term value creation.
Frequently Asked Questions
1. What are profitability ratios?
Profitability ratios measure how well a company turns its sales, assets and shareholder money into profit. They include margin ratios (gross, operating and net margin) and return ratios (ROE, ROA and ROCE).
2. What is the difference between margin ratio and return ratio?
Margin ratios measure profit as a share of revenue, while return ratios measure profit against the capital invested in the business.
3. What is the difference between ROE and ROCE?
ROE shows the profit earned on shareholders’ equity alone. ROCE shows the operating profit earned on all long-term capital, both equity and debt. ROCE is the fairer measure for companies that borrow heavily.
4. Can a company have high ROE and still be risky?
Heavy borrowing can push ROE up even when the business itself has not improved. Always use a few ratios to check the health of the company. Along with ROE, check the debt-to-equity ratio and interest coverage.
5. Where can I find profitability ratios for Indian stocks?
The NSE and BSE websites and company annual reports all publish them. There are many screeners also that show trends and let you filter stocks by ROE and ROCE.