How to Use a Trading App for Better Stock Market Analysis?
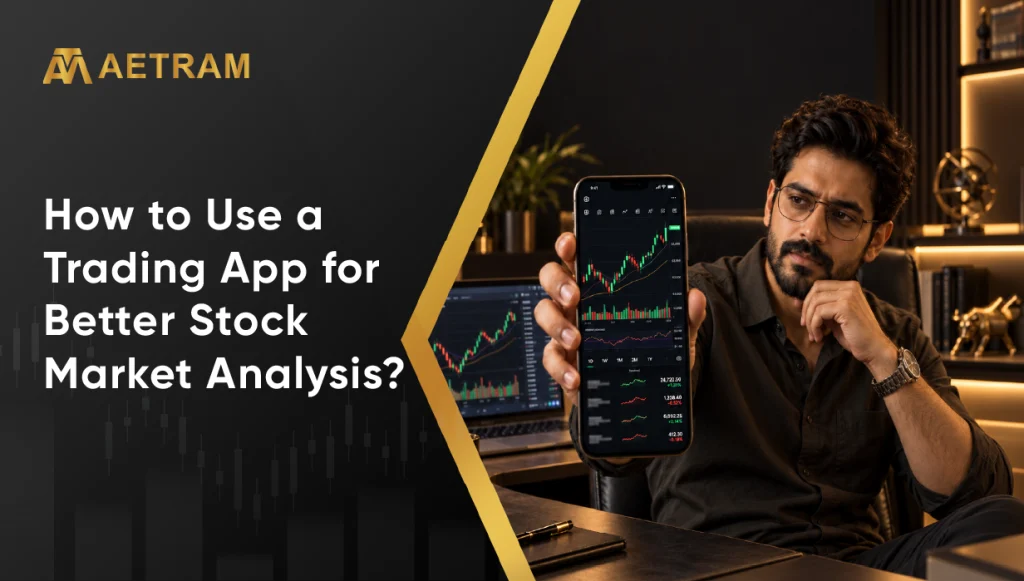
For instance, you have a particular stock that you wish to analyse. You will have to consider the stock’s price movement, analyse the charts, compare it to other stocks, check trading volumes and possibly track technical indicators. If you are doing all of this through different platforms, then it might prove quite difficult to manage. However, there is a tool called a trading application that can help you bring all these things into one place to make your tracking, analysis and monitoring of stocks easy. However, this alone is not enough. The actual advantage lies in understanding how to utilize these features. Here is how to use a trading app to do your stock analysis.
Create a Selective Watchlist First
Instead of compiling a list of all those stocks you get interested in, you need to make a selective list of those stocks which you really want to keep an eye on. For example:
- Stocks you are researching
- Long-term holdings
- Short-term trading opportunities
- Sector-wise stocks
- Stocks approaching important price levels
- A concentrated list makes it easier to spot significant moves without being sidetracked by hundreds of stocks.
Charts for Understanding Price Behavior
The present price of a stock will tell you its trading level. Charts help you gain insight into how it reached there. Most trading platforms give you interactive charts where you can study price behavior through various time frames. You can use them to:
- Trends
- Support and resistance
- Breakouts and breakdowns
- Price consolidation
- Volatility
- Previous highs and lows
As an example, examining a stock only in the daily chart may reveal that it is bullish, while using a shorter timeframe may prove that there is considerable intraday volatility.
How to Make Technical Indicators Work for You
Numerous trading applications include technical indicators like:
- Moving averages
- RSI
- MACD
- Bollinger Bands
- Volume indicators
Such technical tools will be useful in studying the behaviour of prices and volumes. For example, moving averages can be helpful in identifying trends, whereas RSI is often employed for studying momentum. Volume may offer more insight into price action. Indicators must not be considered as automatic buy/sell signals. Employing too many indicators may complicate your chart analysis. Select indicators suited to your style of trading and understand what these indicators measure.
Use a Stock Screener for Shortlisting Stocks
When you are trying to shortlist stocks in a broad market universe, manually screening each stock can prove to be a tedious process. A stock screener will help you shortlist stocks based on specified criteria. Stocks can be screened based on:
- Market capitalisation
- Price movement
- Trading volume
- Valuation metrics
- Technical indicators
- Growth metrics
- Other fundamental or market conditions
For instance, rather than examining a hundred stocks one by one, it would be better if you develop a screen for companies that have met certain criteria according to your research purpose. This does not give any clues regarding the stock that you should purchase. It just gives you a hint about where you should continue your search.
Volume with Price
Price will let you know the direction of the stock. The volume, on the other hand, could give you another dimension of information concerning the stock, particularly the intensity of trading associated with the price movement. For example, if there has been an unusually sharp rise in the price of a particular stock, volume along with the price could reveal you if there was an increase in the trading activity as well.
Comparison Between Stocks of the Same Industry
The trading software can also be used to compare various stocks. Rather than focusing on a single stock, create a list that includes more than one company operating in the same industry. For instance, when researching bank stocks, compare several banks at once. Some of the aspects that can be compared include:
- Price performance
- Market capitalisation
- Valuation
- Trading volume
- Financial performance
- Relative price movement
- This can assist in providing context, which you may have otherwise missed by examining just one firm.
Use Options Data When Relevant
If you trade or analyze derivatives, an options chain can offer extra insight. Depending on your software, you will be able to see:
- Call and put prices
- Strike prices
- Open interest
- Change in open interest
- Volume
- Implied volatility
It will also help you to know the positioning of options in relation to various strike prices. Nevertheless, option numbers could prove quite tricky and the values of the individual indicators are not supposed to give direction on their own.
Use Alerts Rather Than Continuously Watching The Prices
There is no need for you to watch your trading application the whole time that the market is trading. In case there is any stock which you want to watch out for until it hits certain price, then using alerts would be more effective. For instance, in case you have been watching certain stock near certain prices, then setting an alert will help you to know the same.
Combine Various Methods
It is only when we integrate various elements that the true advantage of using an app becomes evident. Your approach to researching might be as follows:
Watchlist → Screener → Chart → Indicators → Volume → Fundamental information → Risk assessment
The watchlist will help you pinpoint what to be watching. The screener will help you to filter down your universe. The chart will help you analyse price action. The indicators will help you in analysing your chart further. Fundamentals will help you understand the business. All of this can result in a systematic analysis procedure.
Don’t Let Your App Decide Things For You
A trading app can provide you with various forms of analysis tools such as data, charts, indicators, etc. But it can never remove all uncertainties from your trading decisions. A stock that shows up on a screener is not necessarily a good one for investing. An indicator giving you a signal is no way a guarantee of making a successful trade. Strong price action does not necessarily imply that price will go in the same direction. Consider before taking a position:
- Your investment or trading objective
- Risk tolerance
- Valuation
- Company fundamentals
- Market conditions
- Position size
- Exit strategy
- Keep Your Analysis Simple and Consistent
Just because there are many tools available does not necessarily mean that you have to make use of all of them. Too much data may sometimes make decision-making even more challenging. Create a set pattern instead. For instance, the process may consist of identifying companies through the screener, studying charts, analyzing relevant financial information and deciding whether they need to be researched further. The pattern will of course depend on your investment horizon and goals, but the most important thing here is to come up with a process that works for you and allows you to implement it consistently.
Make your Trading App your Analysis Environment
The trading app is not just a tool for placing buy and sell orders. It can also become an environment for stock monitoring, screening, chart analysis and market observation if equipped with proper features.
Analyze Better, Not Only More
A trading application can provide you with much information about the markets. But more does not mean better; the real benefit is in the knowledge of what needs to be analyzed and compared and what really matters for your trading. Utilize watchlists to keep everything organized, use screeners for searching, apply charts and indicators to analyze the price movement and alerts to monitor the levels of interest without watching the market all the time. It’s an application that will help you the rest depends on you.
From stock screening to technical analysis, having the right tools in one place can make market research easier. Explore Aetram to learn more.
FAQs
1. Can a trading app help with stock market analysis?
Yes. Many trading apps offer tools such as watchlists, stock screeners, interactive charts, technical indicators, market data and alerts that can support stock analysis.
2. What is the most useful feature for analysing stocks?
There isn’t one feature that is best for everyone. The usefulness of a screener, chart, watchlist, options chain or other tool depends on your investment or trading approach.
3. Should I use multiple technical indicators?
You can, but more indicators don’t necessarily mean better analysis. It’s generally more useful to understand a smaller set of relevant indicators and use them consistently.
4. Can a stock screener tell me which stock to buy?
No. A screener filters stocks based on selected criteria. The results still require further research and analysis before any investment or trading decision.
5. How can I avoid constantly checking my trading app?
Use focused watchlists and price alerts to monitor stocks that matter to you. This can help you stay informed about important movements without reacting to every short-term price change.