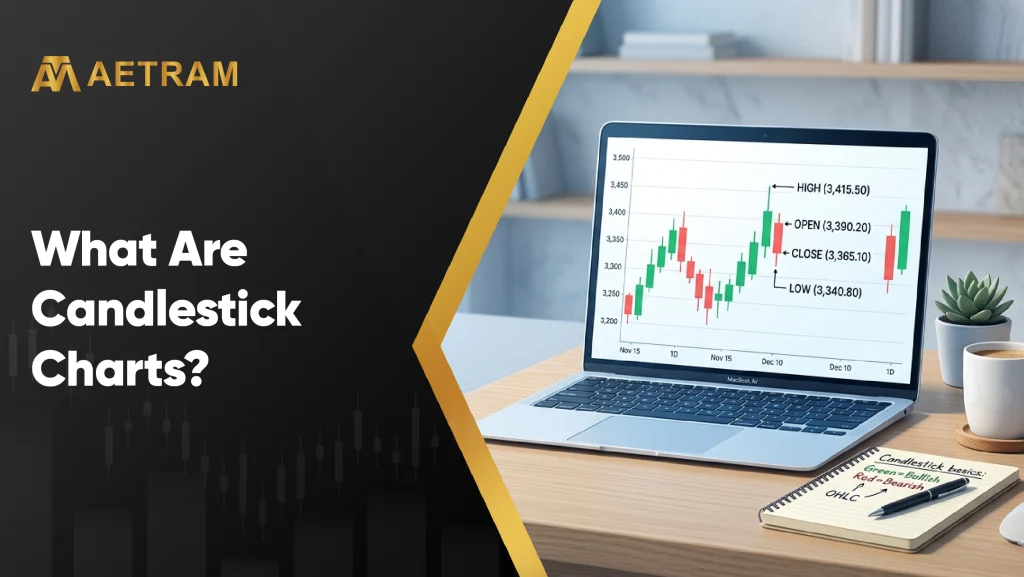
What Are Candlestick Charts?
If you want to understand technical analysis, the first thing you should know is how to read the price. And to read the price you must know how to interpret candlesticks, which has a lot of information. Without knowing how to interpret the candlesticks, it becomes extremely difficult to learn technical analysis.
A candlestick is visually appealing than just rows and columns of prices and it is used to represent price movements of various assets like indices, stocks, commodities, futures, options, currencies, cryptocurrencies, etc. Candlestick gives insights into overall market sentiments and any potential reversals.
Components of Candlestick
Candlestick has three components, namely the body, upper wick and lower wick. The wick is also called shadow. A body will be formed between the open price and close price. You can find the wick on top and bottom of the body. The upper wick will be on top of the body and the lower wick will be below the body. The end of the upper wick is the highest price in a specific timeframe and end of the lower wick is the lowest price in a specific timeframe.
The size of the body and wicks gives traders a lot of information about the security and the overall market sentiments. When the body is bit with smaller wicks, it typically shows that either the buyers or the sellers were dominant during the period, indicating clear momentum in one direction.
On the other hand, long wicks with smaller body suggest that price of the security moved significantly up or down before settling, which often points to indecisiveness and uncertainty. These longer wicks may signal that traders were trying to push prices up or down, but eventually the movement was rejected that led to a reversal in direction before the session ended.
Three Main Types of Candlesticks
Bullish Candlestick
A bullish candlestick is formed when the closing price is higher than the opening price. This means that there are more buyers of a security than sellers and it indicates the market participants are optimistic about the security or the overall market.
Bearish Candlestick
A bearish candlestick is formed when the closing price is lower than the opening price. It means that there are more sellers than buyers and the market participants are pessimistic about the security or the overall market.
Doji Candlestick
Doji candlestick is formed where the closing and opening prices are the same or almost the same. This means there neither the buyers nor the sellers are in control. It denotes the market is indecisive. Sometimes it will look like a cross or a plus sign as the body is very thin or virtually non-existent.
Using Timeframes in the Candlestick Charts
The timeframe a trader chooses while using candlestick charts will influence their interpretation of the market and decision. Every candlestick reflects trading activity for a specific period of time. The timeframe can be one second, 1 minute, 1 hour, 1 day, etc. Modern day technical charts software allows you to create candlesticks based on your own timeframes like 2 days or 5 days, 3 weeks, etc.
Each timeframe will help you decode the market at different levels and it is likely to give you the whole picture. For instance, shorter timeframes show rapid price fluctuations, while longer timeframes like 1 week or month, etc. Will show you broader trends. This variation in detail makes it essential to pick a timeframe that aligns with your trading approach.
If your trading style is aggressive and objective is to spot quick opportunities, 1 minute or 5 minutes or 15 minutes charts, etc. might be helpful. If you are positional trader or a long-term investor and you are looking at long-term trends, then weekly or monthly charts could provide a better picture.
By using multiple timeframes, traders and investors can decipher patterns and trends that might not be obvious in a single timeframe. This flexibility allows for a more nuanced and strategic analysis, making it easier to make informed decisions that match your overall trading plan.
Short timeframe: This is ideal for intraday traders, scalpers, or those looking for quick entry and exit point. When you are using short timeframe like a few seconds or minutes, you may receive signals that require immediate market reactions but they can also be more prone to noise and false signals.
Medium timeframe: This timeframe is used by swing traders as the medium timeframes balance the detail of short-term movements with broader market trends that can offer a clearer view of potential direction changes. In medium timeframe, one candlestick can represent 30 minutes, 1 hour, 2 hours, 4 hours or 1 day.
Longer timeframe: This timeframe is preferred by investors holding their positions for weeks, months or even years. Longer timeframe candlestick patterns provide insights into the market’s overall trend and the price action is less affected by daily fluctuations and has less noise as well as false signals.
Conclusion
If you are planning to trade in the financial markets, understanding price action becomes vital and candlestick gives you the whole picture of the price at different timeframes. Candlesticks reveal the underlying market psychology and the decisions made by market participants. By learning to decode candlestick, you will get valuable insights into how buyers and sellers are reacting at different times.
However, relying on candlestick patterns alone without considering broader market context will be misleading and it can lead to bad decisions. Markets are influenced by many factors, including macroeconomic data, corporate actions, volume and overall trends and these are not captured completely in candlesticks.
Candlestick patterns should not be used as a standalone signal and it must be viewed as part of a larger price action analysis. A series of candlesticks will form various patterns and traders must also learn to use technical indicators to understand the market and take informed decisions.