Difference Between Golden Cross and Death Cross
In technical analysis, there are numerous technical indicators and traders use a combination of these technical indicators to analyze the trend in the market. One of the most popular and easiest to use indicators is the moving average indicator. Using different numbers for calculating moving averages, traders and market participants try to predict the direction of the market.
Among them, the 50-day moving average (50-DMA) and the 200-day moving average (200-DMA) are important and they are used extensively. These two moving averages are used together on a daily timeframe to check if the overall market or a particular sectoral index or a stock is bullish or bearish. Using these two indicators there are two popular technical signals namely Golden Cross and Death Cross.
In this blog, let us discuss how these DMAs are used together by traders and how it is interpreted by market participants.
What Is a Golden Cross?
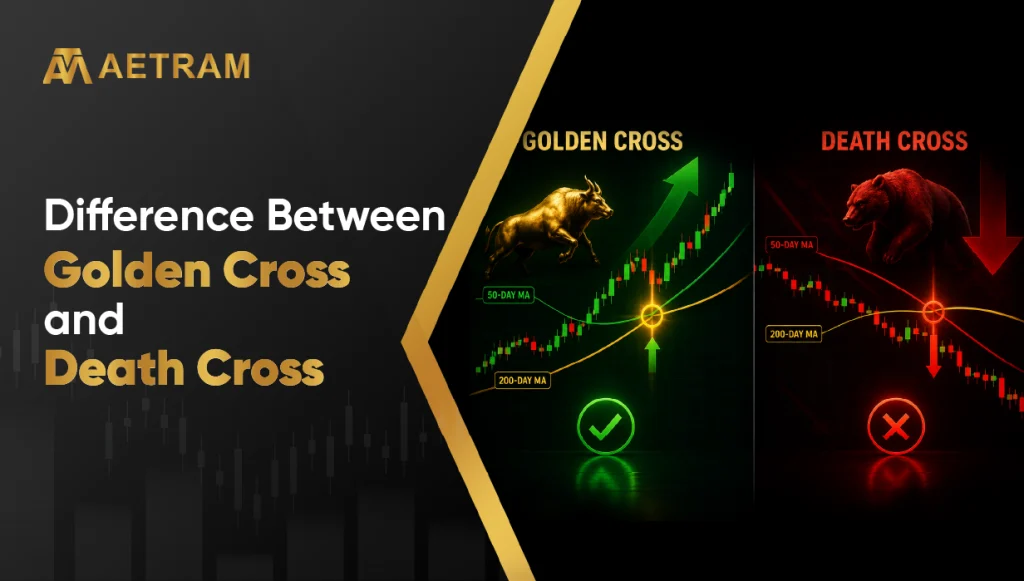
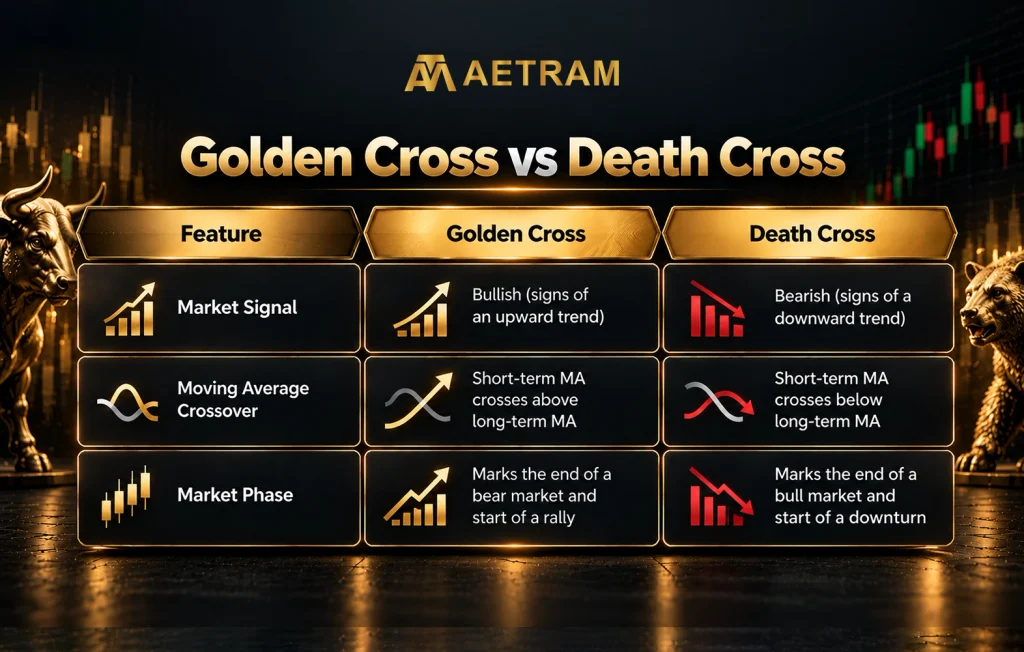
A golden cross is one of the famous technical signals and it represents bullishness in the stock market. A golden cross signal is formed when a 50-day moving average (shorter-term moving average) crosses above a 200-day moving average (longer-term moving average). Whenever this signal shows up on the technical charts, it is considered that the market sentiment is shifting from bearish or neutral to bullish.
Three Stages of a Golden Cross
Downtrend exhaustion: The prevailing downtrend will start to lose momentum and the selling pressure starts to ease.
Golden Cross: In this stage, the 50-DMA line which was below the 200-DMA will move upwards and cross the 200-DMA, forming the actual golden cross.
Sustained uptrend: If the 50-DMA holds strong, it will stay above the 200-DMA line and both moving averages (50-DMA and 200-DMA) will start moving upwards and they will act as support levels for the stock or index. This uptrend will continue for a few weeks or months.
What Is a Death Cross?
A death cross is the opposite of a golden cross. This technical signal represents bearishness in the overall market or sector or stock. This signal occurs when the 50-DMA cuts the 200-DMA from above to cross the 200-DMA line and trend below the 200-DMA.
This tells market participants that the recent price momentum is weakening and that sentiment may be shifting from bullish to bearish. It also suggests the sellers are having an upper hand. When a death cross appears, it is a warning for traders and investors to pay closer attention to broader downside risk. This signal usually develops after a prolonged uptrend has already peaked and there is a sustained selling pressure which pushes the shorter moving average (50-DMA) below the longer one (200-DMA).
Three Stages of a Death Cross
Uptrend exhaustion: Buying momentum starts fading after a prolonged rally and the sellers takeover the market
Death cross: Here, the 50-DMA which is the short-term moving average slips below the 200-DMA, forming the death cross.
Extended downtrend: Both the moving averages (the short-term 50-DMA and the long-term-DMA) continue to fall and these two will start to act as resistance levels.
Both the signals, golden cross and death cross, are considered lagging indicators as it confirms a trend change rather than predicting one in advance.
How reliable are these crossovers?
It is always tempting for traders to look at these signals and make trading decisions with a lot of confidence. But the sad truth is no technical indicator can be 100% correct in the market. It is always better to use a few technical indicators for confirmation before making any trading decisions.
Moving averages are calculated based on past prices and hence become lagging indicators. Any signal given by these lagging indicators are slow and the signals appear after the trend has already started. By the time a golden cross forms, a significant part of the rally may already be behind you.
Death cross cannot predict the start of a downtrend as it is a lagging signal based on lagging indicators (50-DMA and 200-DMA). Therefore, a death cross sometimes can be close to the point where selling pressure is already exhausted. It means the markets have bottomed out shortly after one appears rather than falling further.
In a range-bound or sideways market, the 50-DMA and 200-DMA can cross back and forth multiple times without a genuine trend developing. This can generate false signals and if a trader depends only on this, the trader will be confused and end up making wrong decisions.
A crossover should not be viewed in isolation. It should be always viewed along with rising trading volumes. This is considered more credible than one that occurs on thin volumes. Due to these reasons, experienced technical analysts treat the golden cross and death cross as directional filters rather than precise entry or exit triggers.
Practical Framework To Use Crossovers
If you want to use a golden crossover or death cross signal, don’t use it separately. Always combine it with momentum indicators like RSI or MACD, or trend-strength indicator like ADX, to validate the signal before taking any trading decision. Use it as a trend filter not a standalone trigger.
Check the volumes around the crossover because higher-than-average volume on the day of crossover will add conviction to the signal. The trader will also get some confidence before taking the decision.
Do not forget to look at the benchmark index or the related sectoral context. A golden cross on an individual stock is more meaningful when the broader index or sector is also trending favourably.
As part of risk management, set the exit parameters in advance. Traders taking positions around a golden cross often place stop-losses below recent swing lows, while those shorting a death cross may place stops just above the 50-DMA.
Further, if you plan to invest in equities, you must not ignore the fundamentals. Especially for long-term investors, a technical crossover should complement and it should not replace fundamental research on earnings and valuation.
Limitations of Crossovers to Keep in Mind
There can be false crossovers especially in individual stocks which have lower liquidity and the crossovers can reverse quickly.
Both the indicators, 50-DMA and 200-DMA, smoothen the price of stocks or indices over long periods and hence the signals are lagging inherently. So it can give you a relatively late indication about a trend change compared to the time the actual trend happened.
As an investor, if you are relying solely on moving average crossovers without considering price action, support and resistance zones, or news-driven catalysts like RBI policy, global cues, quarterly earnings, etc., then it can lead to poor timing decisions.
Conclusion
The golden cross and death cross are two popular patterns which are widely observed by technical analysts. For traders and investors, the prudent thing to do is not to trade on these crossover signals alone but use them as one of many methods of technical analysis. It should be used along with other tools like volume analysis, momentum indicators, strong fundamental research, etc. as both are lagging signals.
Frequently Asked Questions (FAQs)
1. What is the difference between the golden cross and death cross?
A golden cross occurs when the 50-day moving average crosses above the 200-day moving average, signalling a potential bullish trend. A death cross is the opposite where the 50-DMA crossing below the 200-DMA, signalling a potential bearish trend.
2. Does a death cross always mean a crash is coming?
Not really, because a moving average crossovers lag price action, a death cross may appear after a large part of the decline has already happened and markets have sometimes bottomed shortly afterward.
3. Which moving averages are used to identify these patterns?
The most common combination is the 50-day and 200-day moving averages, though some traders also use variations like the 20-day and 50-day or 50-day and 100-day on shorter timeframes.
4. Can the golden cross and death cross be applied to individual stocks and indices?
Yes. These patterns apply to the Nifty 50, sectoral indices like Nifty IT Bank Nifty, etc. and individual stocks listed on BSE and NSE. It can be used for commodities and derivatives also.