What Are Candlestick Patterns? 10 Common Patterns Explained

Candlestick pattern recognition is the most popular technique used in technical analysis. It helps interpret the price movement, determine the sentiment of the market and anticipate any possible reversal of the trend in the market. Whatever may be the financial instrument that you are looking into, be it stocks or indices or anything else, an understanding of candlestick patterns will definitely help you a great deal.
Now, let us try to understand what candlestick patterns are and learn about some of the 10 most common bullish and bearish candlestick patterns that every trader must know.
What are Candlestick Patterns?
Candlestick patterns are certain chart formations created by one or more candles on the chart. In a typical candlestick chart, there are four main price levels shown:
- Open: Price level where the asset starts trading in the period.
- Close: Price level where the asset stops trading in the period.
- High: Highest price level reached by the asset in the period.
- Low: Lowest price level reached by the asset in the period.
The presence of a green-colored candle implies that the closing price is higher than the opening price and that there is buying pressure in the market. The presence of red-colored candle implies that the closing price is lower than the opening price and that there is selling pressure in the market. There are generally two types of candlestick patterns based on the formation:
- Bullish candlestick pattern: This type of pattern may indicate either an upward reversal or buying pressure in the market.
- Bearish candlestick pattern: This type of pattern may indicate either a downward reversal or selling pressure in the market.
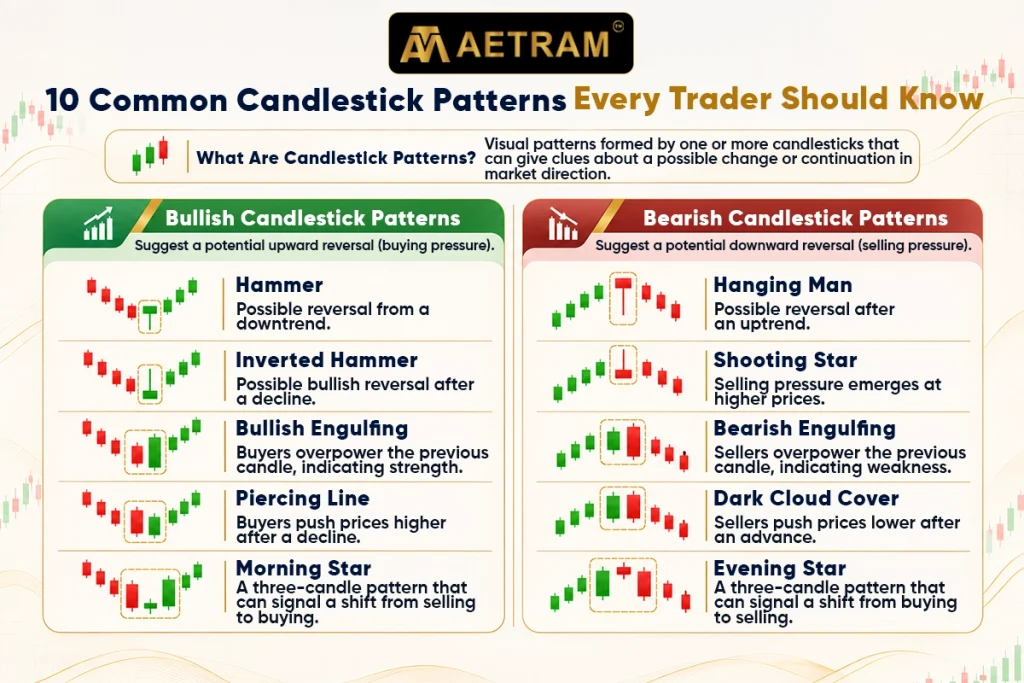
Let us take a look at five common patterns from both categories.
5 Common Bullish Candlestick Patterns
Bullish candlestick patterns are those which indicate that buyers have taken an upper hand in the market.
1. Hammer
Hammer is a candlestick formation that usually emerges after a price downtrend. The formation has a small body on its upper half and a very long lower shadow. The formation implies that sellers pushed the price down, but then buyers intervened and changed the direction.
What it indicates: It can be a possible change in the downward trend.
Example: For example, if a stock has been declining in its price over several days and hammer candlestick formation comes, it indicates that buying pressure is emerging.
2. Inverted Hammer
Inverted Hammer is a candlestick formation that emerges after a downtrend. The candlestick formation has a small real body at the bottom part of the graph and a long upper shadow.
What it indicates: Possible shift in bearish trend to bullish.
Example: Inverted hammer after the continuous fall in price may suggest that interest in the shares has arisen among the buyers. This can be confirmed by a powerful bull candle on the next day.
3. Bullish Engulfing Pattern
This pattern is identified through the use of two candlesticks where the first one is a bearish small candlestick that is followed by a larger bullish candlestick that completely covers the real body of the previous candlestick.
What it indicates: Indicates growing strength of buyers over the sellers.
Example: In case there is an existing trend in a stock that is downward and suddenly a large green candlestick completely covers the body of the previous candlestick.
4. Piercing Line Pattern
This pattern is made up of two candlesticks where the bullish reversal pattern appears after a downtrend where the first candlestick is a bearish candlestick while the second one is a bullish candlestick that opens lower than the closing of the previous candlestick and closes higher than the middle point of the previous candlestick.
What it indicates: The buyers are driving prices upward.
Example: In case there is a fall in price of a stock on one trading day and the same rises on the next trading day and closes higher than the middle point of the previous candlestick.
5. Morning Star
The morning star is a bullish pattern made up of three candlesticks. It is typically formed after the fall trend in the market. It comprises of the following components:
- A large bearish candle signifying heavy selling activity.
- A small candle signifying indecision and less selling activity.
- A powerful bullish candle signifying that the buying force has overtaken.
What it indicates: The mood in the market can shift from selling to buying.
Example: If the price of a security has been falling, these candles will form.
Five Common Bearish Candlestick Patterns
Bearish patterns signify the power of sellers in the market. They are usually formed after the rise in prices.
6. Hanging Man
This is a single candlestick that forms at the end of an uptrend. The Hanging Man is characterized by a small real body situated on top of the formation and a long lower shadow. This indicates that although buyers could push the price higher to close the price, sellers managed to push prices lower.
What it indicates: Reversal following an uptrend.
Example: If there is a stock that moves higher for some time and creates a Hanging Man formation, this is usually taken to signal the start of a downtrend.
7. Shooting Star
This is another bearish reversal chart pattern that is formed in an uptrend. The Shooting Star pattern has a small real body at the bottom and a large upper shadow. This means that sellers stepped into the game when the bulls were trying to drive up the prices of the asset.
What it indicates: Increasing selling pressure and the possibility of a reversal downwards.
Example: If a stock is trading at a high price for that particular session but closes at a nearly equal price as the opening price due to the pressure from the sellers, a Shooting Star pattern can be formed.
8. Bearish Engulfing
The Bearish Engulfing candlestick pattern is made of two candlesticks. First, there is a small bullish candle, followed by a large bearish candle where the real body completely encompasses the previous candle’s real body. This is because the sellers have become stronger than the bulls.
What it indicates: Downward reversal.
Example: If the trend of the stock had been upwards and then a large red candle engulfs the green candle, then the possibility of increased selling pressure may be inferred.
9. Dark Cloud Cover
Dark Cloud Cover is a two-candle bearish reversal formation that mostly forms after a trend of rise. It consists of a bullish candle followed by a bearish candle opening at a level higher than the previous candle’s high or close and closing below the mid-point of its body.
What it indicates: A potential bearish reversal after an advance.
Example: A stock that has risen in one day, but faces heavy selling pressure and closes below the mid-point of the previous bullish candle can form a Dark Cloud Cover pattern.
10. Evening Star
The Evening Star is a three-candlestick pattern that occurs when the market has been trending up. This pattern comprises of:
- The first candle being a long bullish candle signaling strong buying power.
- The second candle is a small-bodied candle that shows that buyers are indecisive or a deceleration in their buying.
- The third and final candle is a strong bearish candle that signals that the sellers are taking control.
What it indicates: A possible shift in market sentiment from buying to selling.
Example: If a stock has been rising and forms these three candles, the Evening Star may suggest that the upward trend is weakening and a downward reversal could follow.
Bullish vs Bearish Candlestick Patterns
Although both categories help traders understand market sentiment, they indicate different possibilities.
| Feature | Bullish Patterns | Bearish Patterns |
| Market sentiment | Increasing buying pressure | Increasing selling pressure |
| Common appearance | After a downtrend | After an uptrend |
| Possible direction | Upward reversal | Downward reversal |
How to Use Candlestick Patterns for Trading?
Identifying the candlestick pattern is not enough – traders must take into account other factors before they decide on whether they should trade.
Here are several methods to improve their use of such patterns:
1. Identifying the Existing Trend
The same candlestick pattern may mean different things in different places within the trend cycle. For example, a Hammer usually signals a possible bullish reversal in case it emerges from a downtrend.
2. Waiting for Confirmation
There is no guarantee that the market will follow the reversal direction. The confirmation in form of the next candle is a common practice for traders.
3. Monitoring Trading Volume
Traders may also watch the trading volume. It may provide some extra information about the level of market involvement.
4. Use Technical Indicators
Combining candlestick patterns with other tools like moving averages, RSI and MACD may help traders determine the market direction and momentum. The use of several indicators provides extra information, but it cannot reduce the trading risks.
5. Take Into Account the Levels of Support and Resistance
Candlestick patterns appearing at the levels of support or resistance may serve as trading signals. For instance, a Hammer at the support level may draw attention of traders who look for a bullish reversal.
Common Mistakes While Interpreting Candlestick Patterns
Even if you know all the candlestick patterns, you can make mistakes in interpreting them. Here is what you should keep in mind:
- One cannot assume that each candlestick pattern will bring a trend reversal.
- Do not try to interpret candlesticks without considering the overall trend in the market.
- Do not ignore the volume of trade and important price levels.
- You must never open a trade based only on a pattern.
Take risk management into account – set your stop loss level.
Understand How To Read The Story Told By Each Candle
Several candlestick patterns allow you to get information about price dynamics and changes in market sentiments effortlessly. No matter if this is a Hammer, Bullish Engulfing, Shooting Star or Evening Star – all these patterns can give you some information regarding possibilities for the future price movements. However, you should know that just one candlestick pattern is not enough for forecasting market dynamics. Analysis of patterns in connection with price trend, volume, support/resistance level and other technical indicators will assist you in making a correct decision.
Use charts and technical indicators to analyze price movements with Aetram.
Frequently Asked Questions
1. What are the most commonly used candlestick patterns?
Some commonly used candlestick patterns include Hammer, Inverted Hammer, Bullish Engulfing, Piercing Line, Morning Star, Hanging Man, Shooting Star, Bearish Engulfing, Dark Cloud Cover and Evening Star.
2. What is the difference between bullish and bearish candlestick patterns?
Bullish patterns suggest increasing buying pressure and a possible upward price movement. Bearish patterns indicate increasing selling pressure and a possible downward price movement.
3. Are candlestick patterns reliable?
Candlestick patterns can help traders understand market sentiment, but they are not always accurate. Their usefulness depends on factors such as the prevailing trend, trading volume, market conditions and confirmation from other technical indicators.
4. Can beginners use candlestick patterns?
Yes. Beginners can start by learning basic patterns such as Hammer, Shooting Star and Engulfing patterns. Understanding how these formations develop can help them read price charts more effectively.
5. Which candlestick pattern indicates a trend reversal?
Patterns such as Hammer, Bullish Engulfing and Morning Star may indicate a bullish reversal. Hanging Man, Bearish Engulfing and Evening Star may indicate a bearish reversal. However, confirmation is important before interpreting them as reversal signals.